500 Agents at a Festival: OAIRA's Crowd Simulation for Behavioral Research
#simulation#behavioral research#AI#OAIRA#labs
David Olsson
Survey research asks people what they think they would do. Behavioral simulation asks agents to actually do it.
OAIRA's Festival Simulation is a multi-agent behavioral modeling environment: 500 AI agents moving through a configurable venue in real time, with live traffic flow analytics, venue occupancy tracking, and configurable crowd dynamics. It's not a game. It's a research instrument for behavioral questions that surveys cannot answer.
What the Simulation Models
The simulation runs a festival environment with configurable venue structure:
Venue types:
- Stages (up to 5) — primary attraction zones with 200-person capacity each
- Food venues (4-8) — 50-person capacity
- Drink venues (4-8) — 50-person capacity
- Art installations (up to 4) — 40-person capacity
- Shops (up to 4) — 30-person capacity
- Rest areas (up to 4) — 25-person capacity
Agent parameters:
- Crowd size: 1 to 500 agents
- Agent speed multiplier: affects how frequently agents transition between venues
- Venue stay duration: how long agents remain at a venue before moving
- Dynamic crowd: agents enter and exit over time rather than all at once
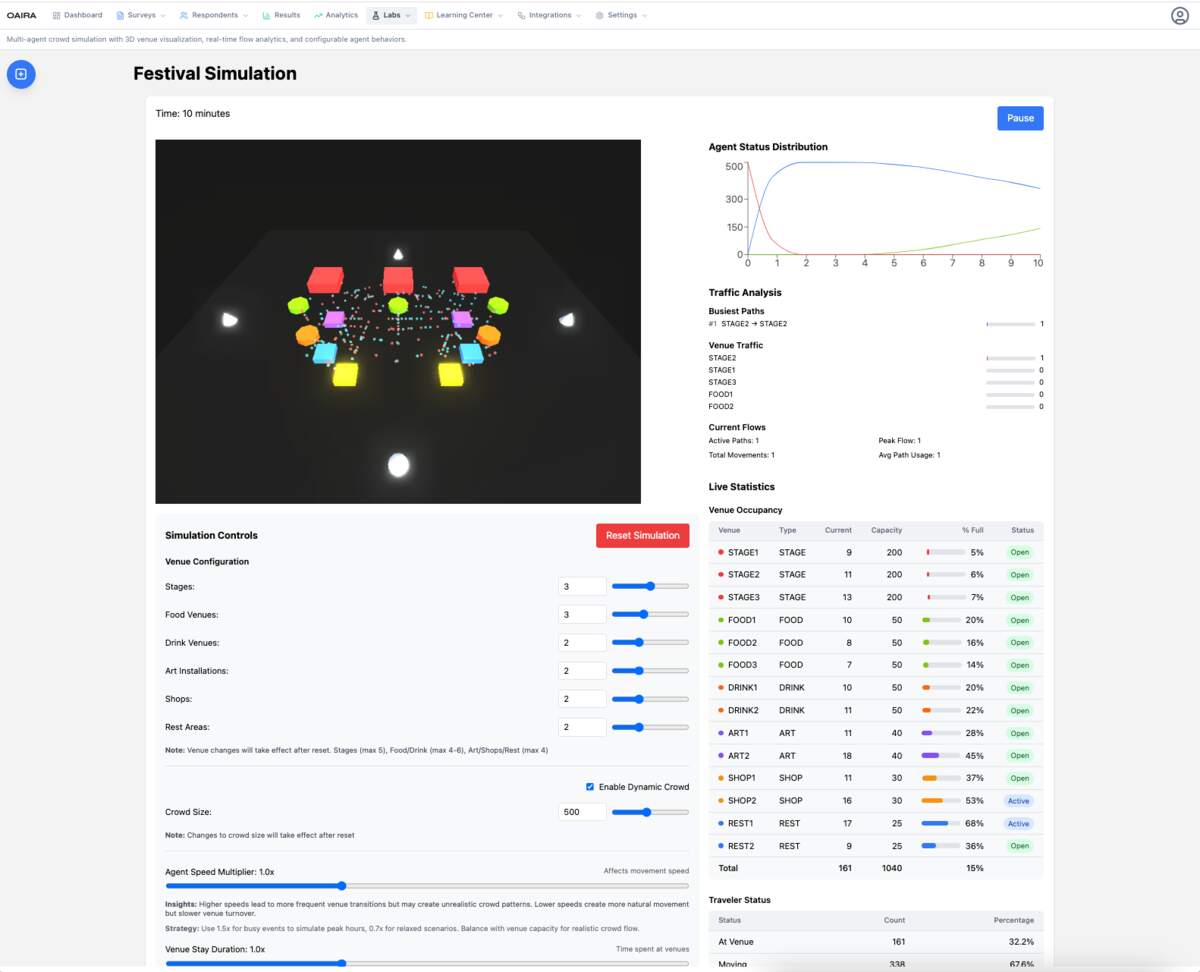
The 3D visualization renders each agent as a colored point moving through the venue space in real time. Traffic paths between venues are visible as flow lines.
Live Analytics
As the simulation runs, OAIRA tracks and displays:
Traffic Analysis:
- Busiest paths between venues (e.g., STAGE2 → STAGE2 is the most-traveled route)
- Venue traffic rankings showing relative footfall
- Active paths, total movements, peak flow, and average path usage
Venue Occupancy: A live table showing every venue, its type, current occupancy, capacity, percentage full, and status (Open/Active). In a running simulation with 500 agents across 20+ venues, this shows real-time congestion patterns — which venues are approaching capacity, which are underutilized.
Agent Status Distribution: A time-series chart showing the proportion of agents in each state (At Venue vs. Moving) over the simulation duration. This reveals crowd rhythm — when agents cluster and when they disperse.
Traveler Status: Real-time split of agents: At Venue (32.2%), Moving (67.8%). Aggregated across all agents and all venues.
The Research Applications
Why does this matter for market research?
Venue design research. Before a venue is built or a festival is planned, simulate how crowds will behave in different configurations. Which layout routes traffic most efficiently? Which food venue positions create the least congestion? Where do bottlenecks form under different attendance scenarios?
Experience flow research. Different venue configurations produce different experience flows for attendees. A simulation reveals which configurations create desirable circulation patterns versus which create dead zones or over-congested choke points.
Capacity planning. At what attendance level does a venue transition from comfortable to overcrowded? The simulation can test this at any configuration before a single person arrives.
Behavioral assumption testing. Survey research might show that "most people say they'd visit all three stages." Behavioral simulation with realistic movement parameters often produces a very different picture. Agents with realistic dwell times and transition costs might cluster heavily at Stage 2 and rarely reach Stage 3. The gap between stated preference and simulated behavior is itself a research finding.
Scenario comparison. Run the same crowd size through two different venue configurations and compare the occupancy distributions. The delta is the research output — quantified, not inferred from opinion data.
AI-Guided Configuration
The simulation interface includes AI-generated insights and strategy guidance:
"Higher speeds lead to more frequent venue transitions but may create unrealistic crowd patterns. Lower speeds create more natural movement but slower venue turnover."
"Use 1.5x for busy events to simulate peak hours, 0.7x for relaxed scenarios. Balance with venue capacity for realistic flow."
The platform reasons about configuration choices in the context of research goals — not just parameter descriptions but guidance on when different configurations are appropriate.
Simulation Beyond Surveys
The Festival Simulation represents a broader point about OAIRA's research model: not all research questions are answerable with self-report data.
Some questions are about behavior under conditions that don't yet exist, or behavior that people can't accurately self-report. How will a crowd behave in a new venue configuration? What happens to traffic flow when one stage is delayed? How does attendance distribution change if food venue capacity doubles?
These questions require a model, not a questionnaire. OAIRA builds that model capacity into the research platform — not as a separate simulation tool, but as one instrument in the research portfolio, alongside surveys, interviews, personas, and deep research.
The research question determines the instrument. Not all research questions have the same answer.
OAIRA is an AI-powered market research platform. The Festival Simulation is available in the Labs section and supports crowd sizes up to 500 agents with configurable venue structures and behavioral parameters.